
My Logging System
A record-keeping system helps to preserve the memory of the ups and downs of stargazing. By looking at the records, we can evaluate different observing sites, equipment, and techniques. Besides, it is enjoyable to re-live some of the experiences, like a time of ultra-good seeing or a night where Jupiter and Saturn were in the same field of view…or the session that ended early for lack of a jacket.
I thought it would be helpful to describe my system so that you can pick up any useful ideas.
Using Microsoft Excel Spreadsheets
My logging system has been evolving as long as I have been observing. I gravitated to Microsoft Excel because I was already familiar with it.
I like Excel because it has a comfortable user interface and gives you the freedom to organize your data any way you like. It allows you to find records and sort them easily.
Starting to use Excel is a bit like moving to a new country. The roads and signs are unfamiliar. You would probably start by learning how to get to work. Once you master that, you could learn other routes. You would learn your way a step at a time.
So, try not to be distracted by the many Excel functions. There will be a few that you will use a lot, and many that you will never use.
The spreadsheet format is very flexible. If you want to create a new category, like “Objects for Kids”, it takes a few seconds to add a column and give it a name. For planning a new observing night, the columns can be moved, so that the useful information is easily visible.
The sort features will help you find specific records.
Here is a cleaned-up version of my spreadsheet:
If you don’t have Microsoft Excel, Apache OpenOffice or Google Sheets can open this file. Unfortunately, many rogue entities offer “free” apps, which function poorly.
The Worksheets
An Excel file is called a workbook. It consists of one or more worksheets identified by tabs. The worksheets are independent of each other (at the beginner level). The following worksheets are in the sample workbook:
Logbook: Contains all of the records. It has three types of records:
Observations: Circumstances and notes for each observation.
Descriptions: Background information for some observed or unobserved objects.
Sessions: Record of Date, Location, and summary of each session.
Constellations: for reference.
Data Explanations: May be helpful for understanding my terminology.
How To: Explanation of some Excel operations.
Using Excel
I would love to do a tutorial, but other people have done a much better job. Why duplicate the effort?
A nice beginner tutorial for Excel: https://edu.gcfglobal.org/en/excelxp/identifying-basic-parts-of-the-excel-window/1/
Another approach to learning Excel is to simply start using it and using online resources to answer your questions.
I have listed a few Excel operations in the How-To worksheet.
Easy Sorting
This Excel feature is very useful, and not widely known:
Here is an exercise in sorting:
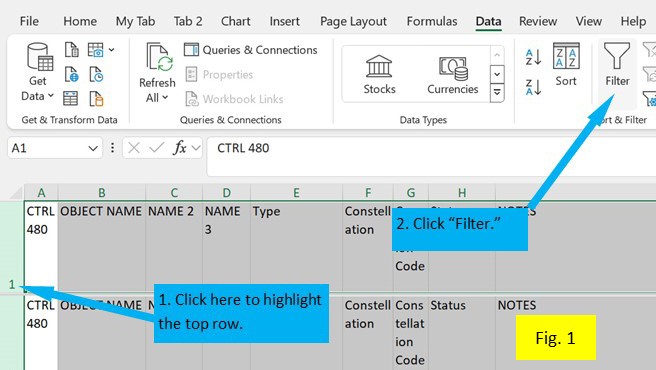
See figure 1. Highlight the first row of the worksheet. Click on “Data” on the top toolbar. Go to the section called “Sort & Filter.” Click on the icon called “Filter.” Note that each cell in the first row now includes a small arrowhead. When you click on the arrowhead, several sorting options appear. The first two options allow the sheet to be listed in alphabetical or reverse-alphabetical order. The bottom section contains a label for each entry in the column with a checkbox. If the box is checked, all rows with that name are displayed.
Here is an exercise, using the Logbook worksheet:
Let’s say you want to list all of your favorite open clusters, grouped by constellation.
1. Click on the arrowhead in the “Type” column.
2. Click the “Select All” box. Note that all of the boxes are now de-selected.
3. Scroll down to the “Open Cluster” label and click on its box, followed by “OK.”
4. The “Type” column will display all of the Open Cluster entries. Note that the arrowhead symbol has been replaced with a funnel-shaped symbol. This is a reminder that only the selected entries are displayed.
5. In the “Status” Column, follow a similar process to show only the lines with the label “Favorites”.
6. In the “Constellation” column, click the arrowhead box and click “Sort A-Z”.
During the Observing Session
On paper, I jot down the items that pertain to the session. These include weather, sky transparency, seeing, start time, end time. If I end the session early, I will include the reason. I also make notes of problems and things to fix later on. For a public event, I try to simply list the objects viewed, rather than make detailed log entries. This information will be transcribed onto the Logbook worksheet.
I use the logging feature of SkySafari to make temporary notes. I select the object, followed by “Create New Observation”. SkySafari stamps the entry with the current date and time (To ensure a correct time stamp, press the “Now” button on the main screen).
I indicate which eyepiece was used, and a three-digit rating for the observation:
First digit: Sky condition, a combination of light pollution, darkness, transparency and seeing. “5” indicates excellent sky condition; “1” indicates near-impossible viewing.
Second digit: Visibility of the object. “5” indicates no trouble in locating the object. “1” indicates the limit of visibility. “0” indicates inability to see the object, despite accurate aim of the telescope. If I am not sure of the scope aim, I write “couldn’t find”.
Third digit: Subjective assessment of the visual appeal of the object. “5” indicates a very pleasing object. Lower numbers indicate less enjoyable objects.
Next, I enter my comments.
Later, I transcribe my SkySafari notes to the Logbook worksheet.
Entering the Observations
I begin by sorting the data in the Logbook worksheet by object name.
I search for earlier observations by entering the Object Name into the Search function (Control F). I then review them.
I insert a blank row and enter the new observation data.
I review what I have learned by this observation:
Do I want to observe this object again?
Can I improve my technique?
Do I want to change the Status to “Favorites” or “Showpieces”?
After I enter all of the observations, I sort the data by Date, newest to oldest. I check for omissions by comparing the worksheet entries with the SkySafari list (click on “Observe”, “Observations” in SkySafari).
Protecting the Data
Keep Some of the Old Workbooks
I have made blunders which have caused loss of information. On one occasion, I deleted data which should have been kept. Another time, several observation notes were matched with the wrong object names.
To repair mistakes, it can be helpful to have the older records. After a major revision, I like to use the “Save As” icon to save the worksheet under a new name. (If I close by hitting the “Save” icon, the earlier version is overwritten).
The Last Row Number
This column helps me to account for each line in the Logbook worksheet. The words “Last Row Number” are followed by a number. This is the row number for the last entry. This number should be the previous number, adjusted for entries added or deleted. For example, if the number is 420, and I add 12 new observations, the new number will be 432.
Your Logging System
My logging system doesn’t need to be your logging system. Everyone has different interests and needs. So, you can modify the sample workbook or start with a blank workbook.
Please let me know if things are unclear. I will try to explain things better.
I hope that this article will help you to remember your times under the stars!

Leave a comment